Data Profiler
The data profiler analyses data in a share and gives the user the ability to build a tiering model to determine if savings can be achieved by moving data to different tiers or even into the cloud. The data profiler gives the user a before and after view of costs to help determine the business value of tiering. The following data points can be seen in the data profiler:
-
Total cost of the analyzed storage environment
-
Cost savings vs. previous or reference configuration
-
Cost per storage tier
-
Amount of capacity per tier
-
Number of files per tier
The profiler can run on data managed by Hammerspace, and it does not affect the data or client data access. Data can also be imported from other NAS storage systems by leveraging Read-Only volume assimilation to build a virtual share. See the Hammerspace Assimilation and Data Orchestration [Support article may require login to view.] article to learn more.
| Product documentation for Hammerspace 5.1 is available via PDF download on the Hammerspace Documentation Version 5.1.x page of the Hammerspace License and Delivery Portal. |
Complete the following steps to run the Data Profiler:
-
Open the Management GUI and select Objectives from the left-side navigation menu, and then click the Data Profiler tab.
-
Select a share from the Select Share pull-down list.
-
From the Data pull-down list, select whether you want to analyze the data using Access Time (atime), Change Time (ctime), or Modify Time (mtime).
-
Click the Refresh button to populate the graph. For large data sets, this operation may take some time.
The moment the Refresh button is clicked, the job is submitted and will be executed as a background task. Navigating away from the page will not cancel or affect the background task. -
Once the analysis is complete, enter the $/GB (US-dollar increment per Gigabyte) for the current storage in the Cost field at the bottom of the page, and then click Set as Baseline at the top of the page. This will generate a basis for the current cost of the data.
-
Click on the slider bar to create one or more objectives, set the $ / GB for each objective and slide from left to right to change the level of inactivity. The number of files, the capacity used, and the cost are dynamically updated.
The baseline and the cost(s) can be updated several times to help analyze various scenarios.
Data Mobility
Hammerspace non-disruptively moves data between storage volumes to maintain alignment with objectives. Data may be moved to maintain performance and/or protection requirements, to balance load and avoid contention; or to follow a simple placement rule defined by an administrator.
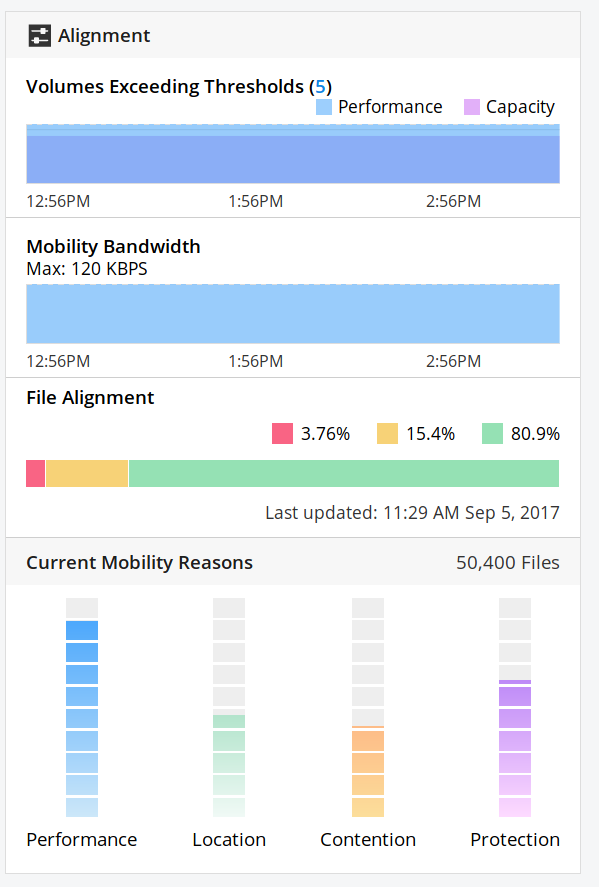
The Alignment column in the Management GUI dashboard displays current alignment status and the reason for current data mobility events.
The Product provides a historical view of data mobility in the form of either a chord diagram or a list that shows where data moved to and from, along with the reason for the data movement.
Mobility History Chord Diagrams
To view mobility history as a chord diagram, select Mobility from the left side panel:
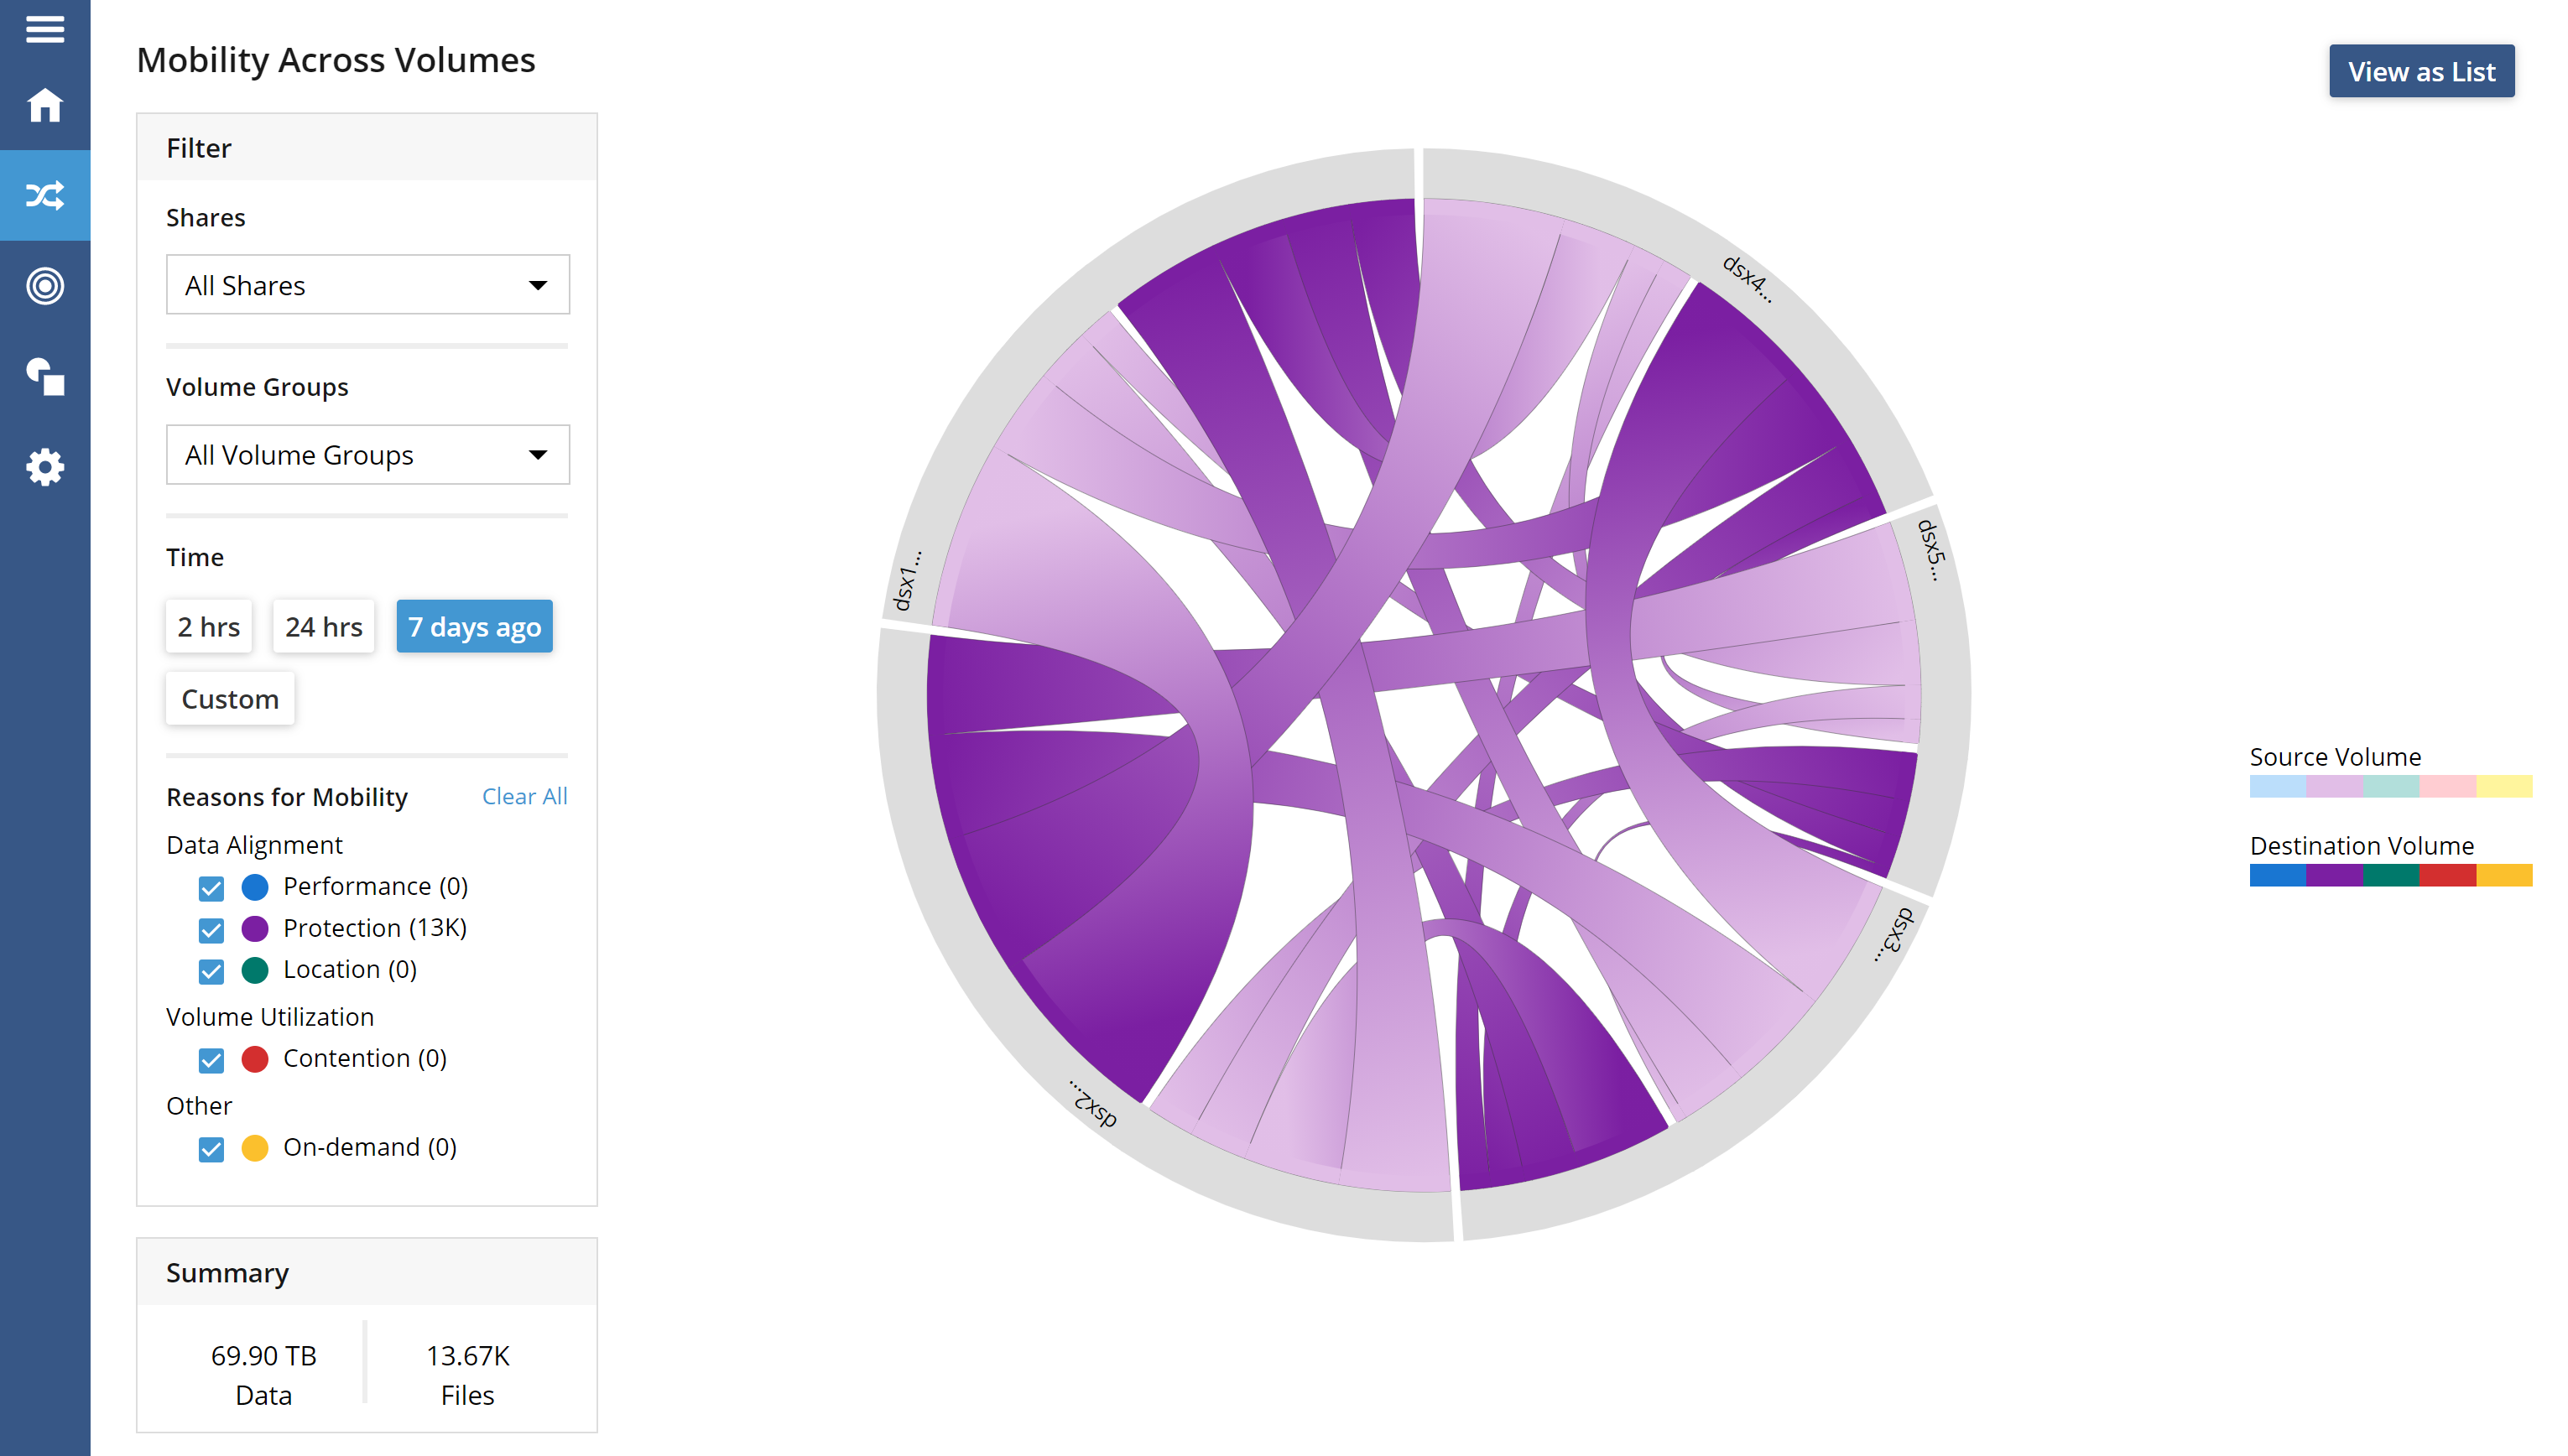
The reasons for data movement are shown in color-coded ribbons. The width of each ribbon represents the relative amount of data moved, and the color is graded from light to dark to help visualize source and destination volumes.
The view can be filtered by share, volume group, mobility reason(s), and by time range.
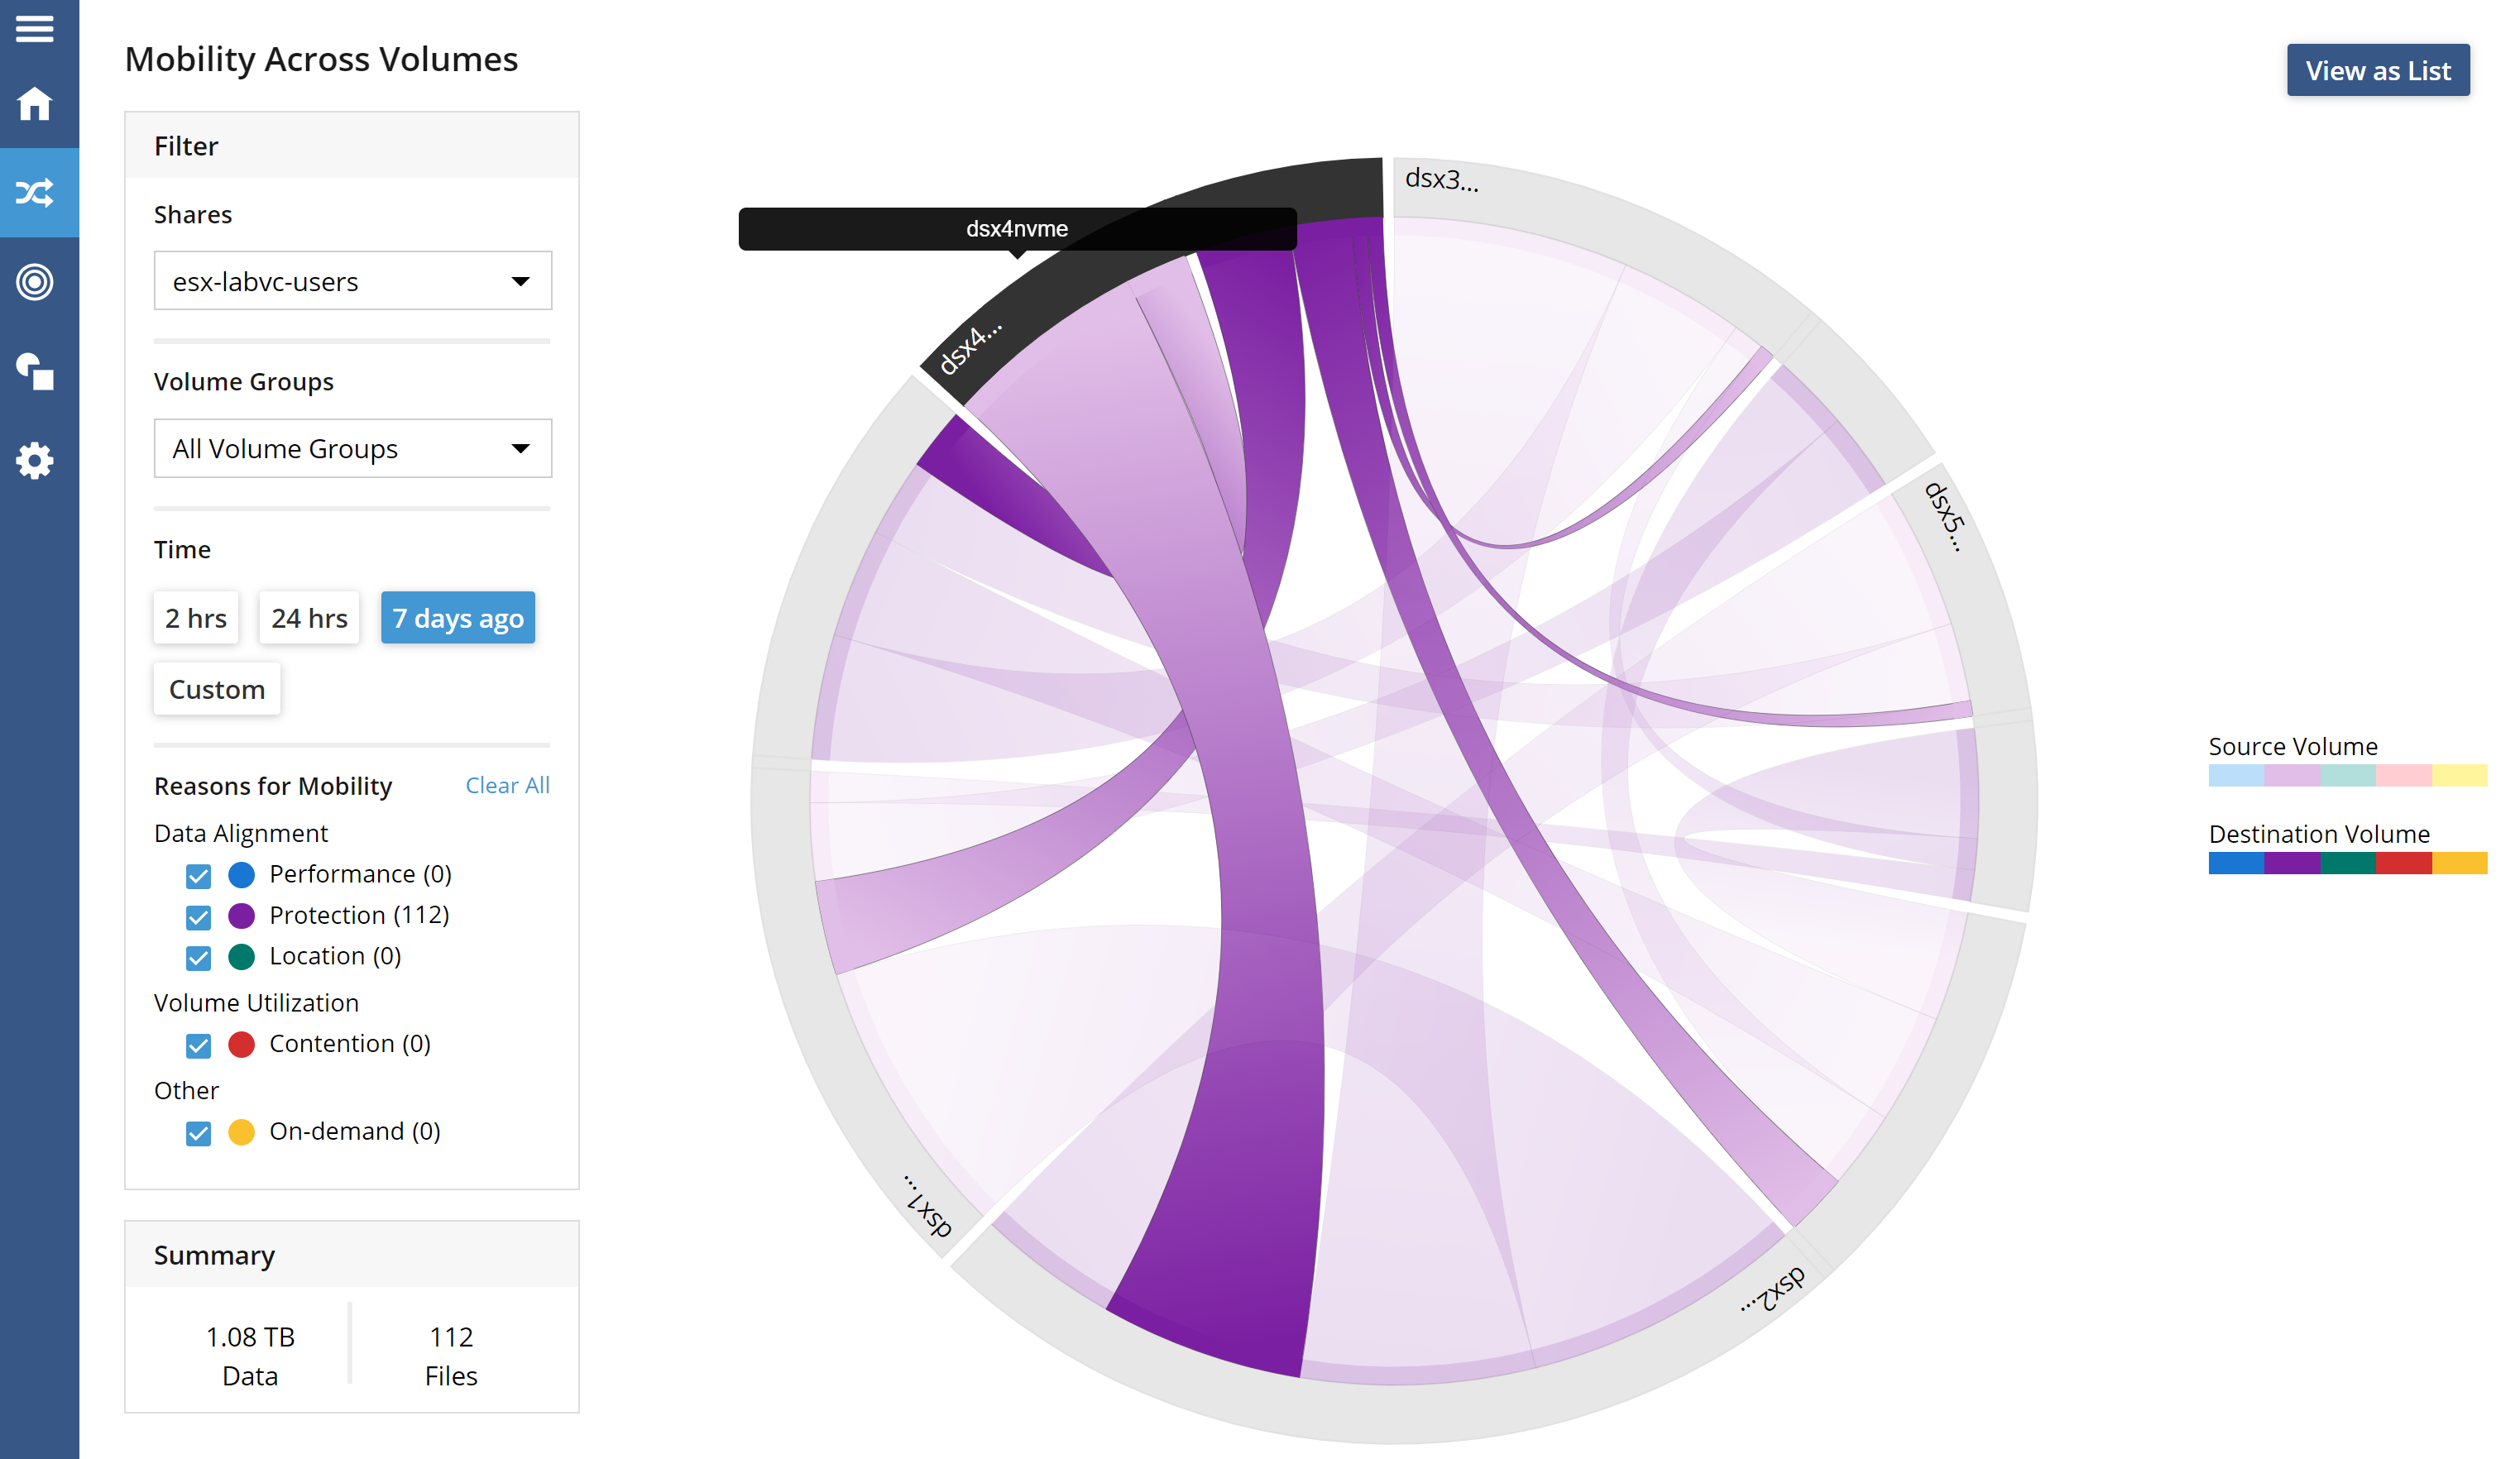
Left-clicking a ribbon lists the files it represents.
Mobility History Lists
To view mobility history as a list, select Mobility from the left side panel and click View as a list:
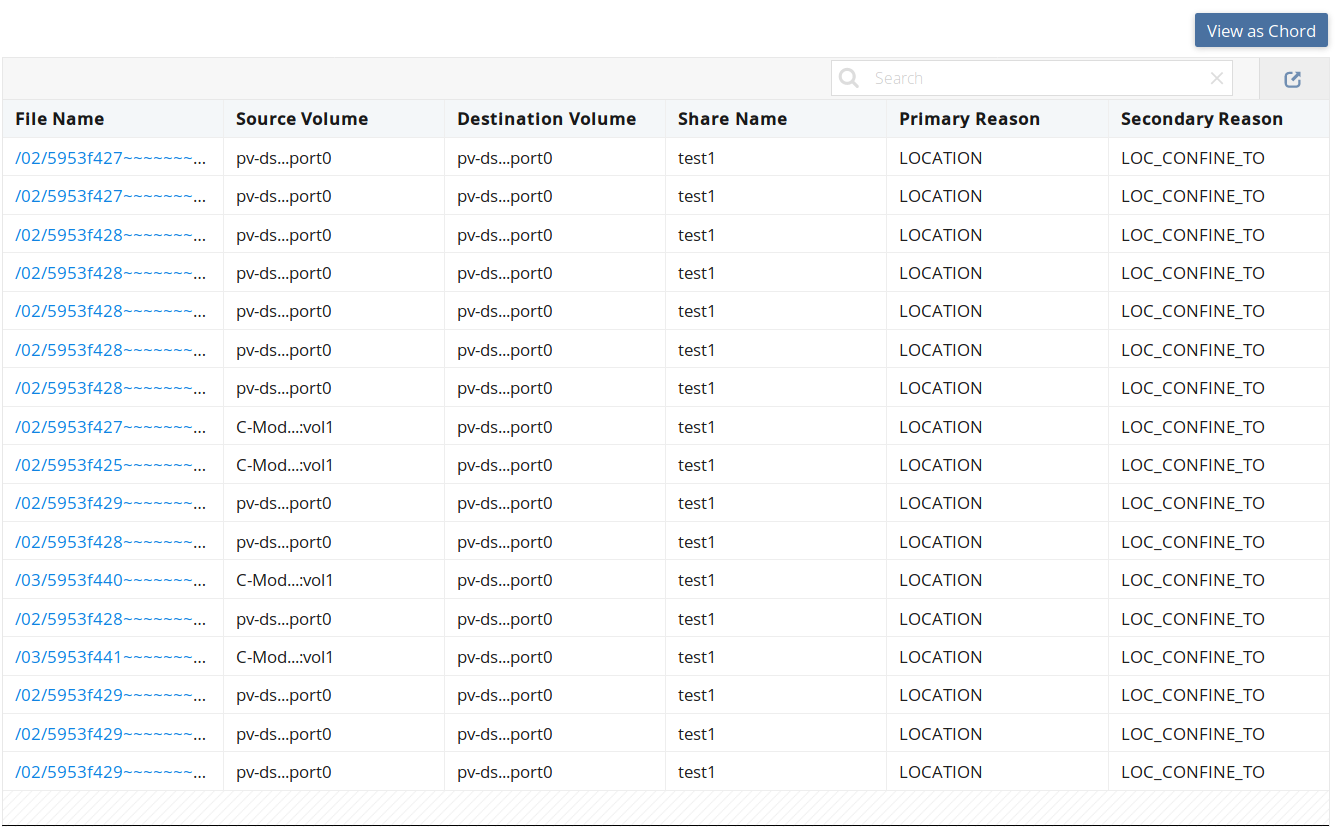
The list shows which files were moved, the reasons for the move, and where they were moved to and from.
The list can be exported to a CSV file by clicking on the arrow in the top-right corner of the table.
Alignment
Hammerspace enables administrators and data owners to visualize the data alignment of objectives, helping them determine whether the objectives set for data can be met with the current resources and configuration.
Alignment Reporting
The following procedure shows how to view alignment information for a share.
-
Select Data from the left side panel, and select the Shares tab.
-
Click on the desired share; this opens the dashboard for the share.
-
Select the Alignment tab. This page displays current and historical information about the alignment of all files and directories on the share.
The following procedure shows how to see the current alignment status of specific directories or files.
-
Select Data from the left side panel, and select the Shares tab.
-
Click on the desired share; this opens the dashboard for the share.
-
Select the Files tab. This shows the top-level directories and files on the share.
-
You can click on a directory to see the files contained in it and the current alignment status for each file.
-
You can click on a file name to view details about the file, including the alignment status for individual objectives applied to it.
-
Alignment status for the file is shown on the File Alignment tile. The colour of the circle on that tile indicates the alignment status.
-
To expand the File Activity chart, click on the
 icon. This chart reports I/O activity, not alignment.
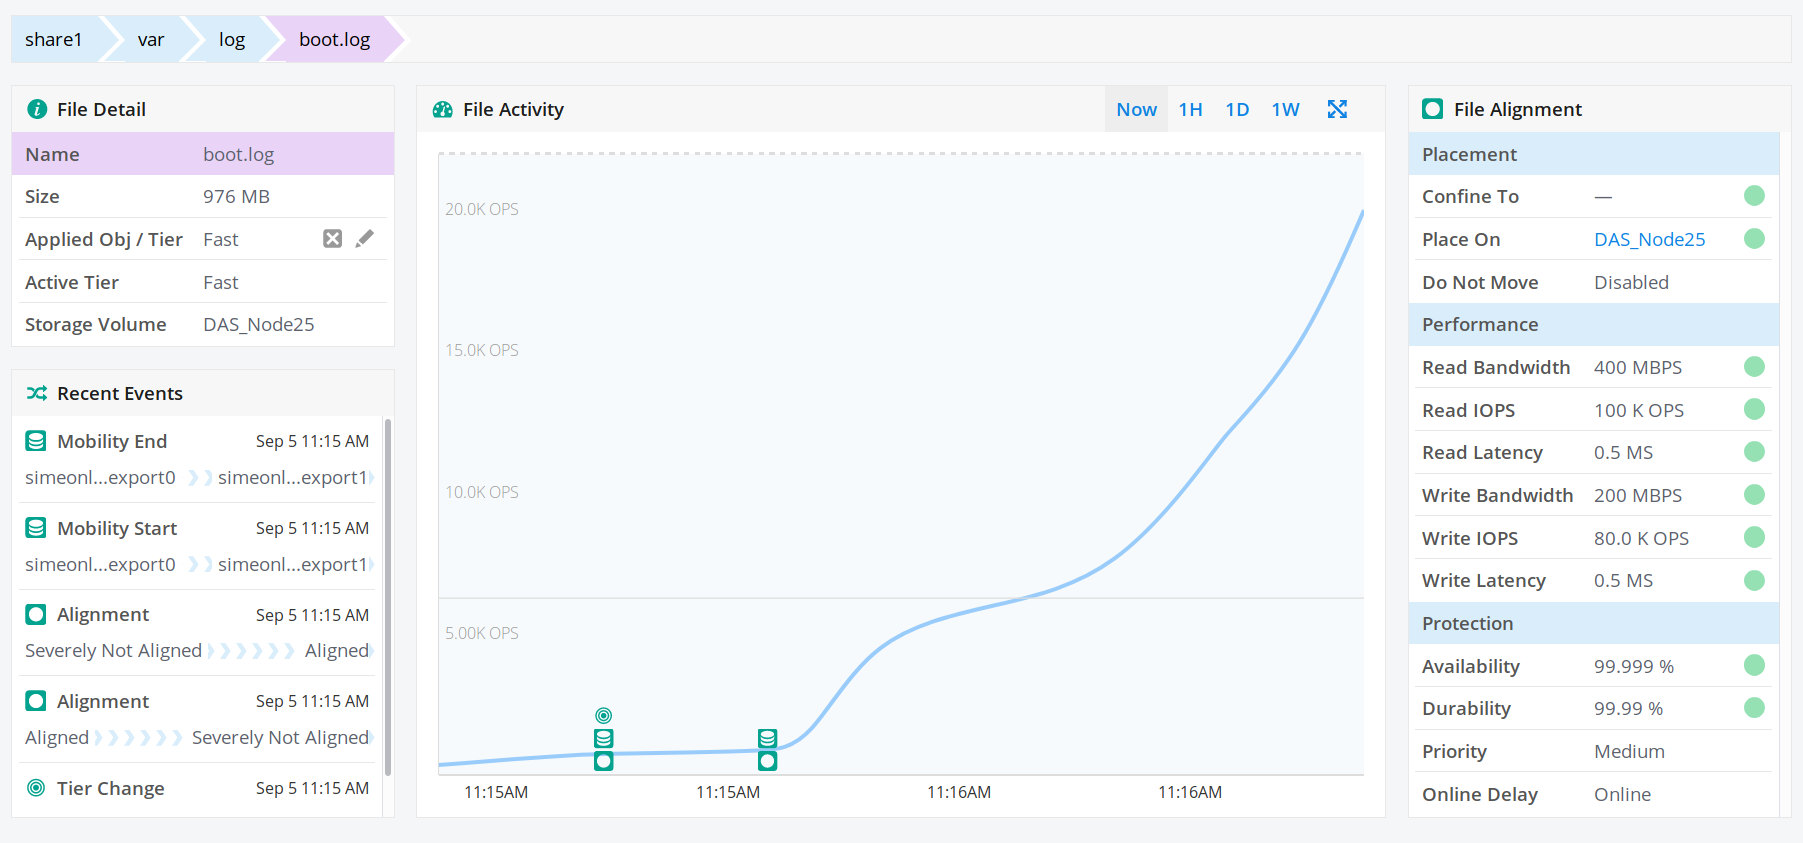 Figure 5. Viewing file IOPs over time
The activity chart shows the current I/O by default. To see I/O activity for the last hour, click on 1H, for the last day click on 1D, and for the last week click 1W.
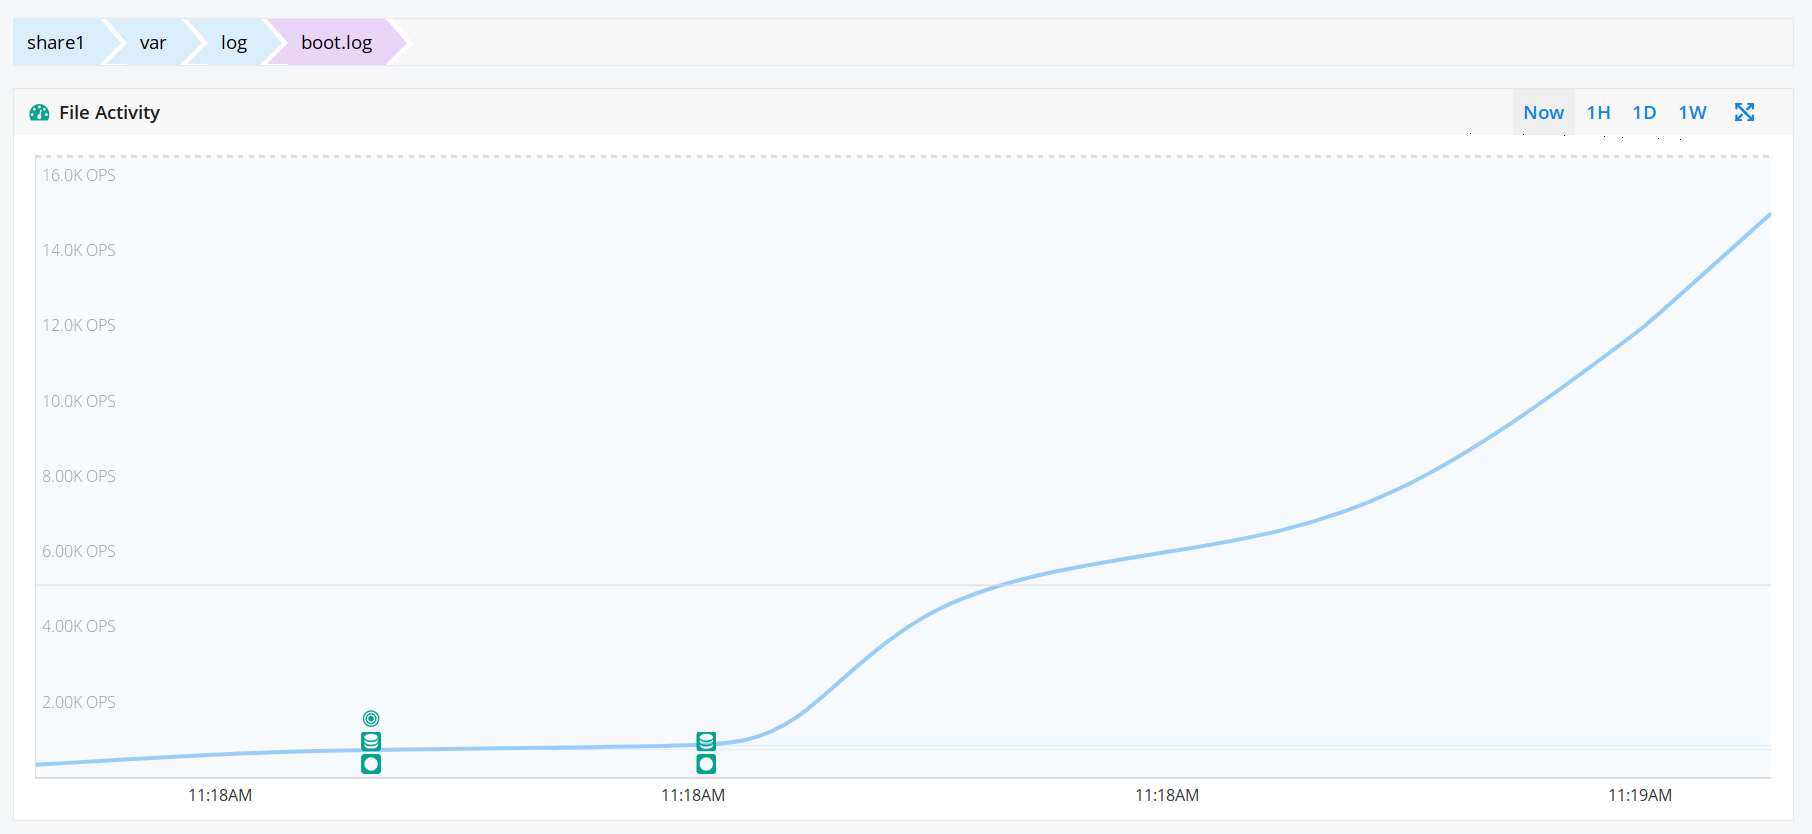 Figure 6. Selecting different look-back periods for file IOPs history
-
Resolving Alignment Issues
Under certain conditions, such as when backend volumes are inaccessible, the Product may not be able to maintain alignment with objectives. In these instances, the Hammerspace software makes automated decisions about data placement.
Administrators can take the following actions to resolve compliance issues:
-
Add storage. Once storage capacity is added, the Product will automatically redistribute workloads across all storage, including the new storage, as required by objectives.
-
Modify Objectives. Administrators can change the Objective requirements for data that is currently competing, or that might soon compete for resources.