Monitoring Tasks and Events
Viewing Events
You can view an events log in the Management GUI.
-
Select Events at the top of the browser window. The GUI displays the events list, in chronological order, from the most recent event.
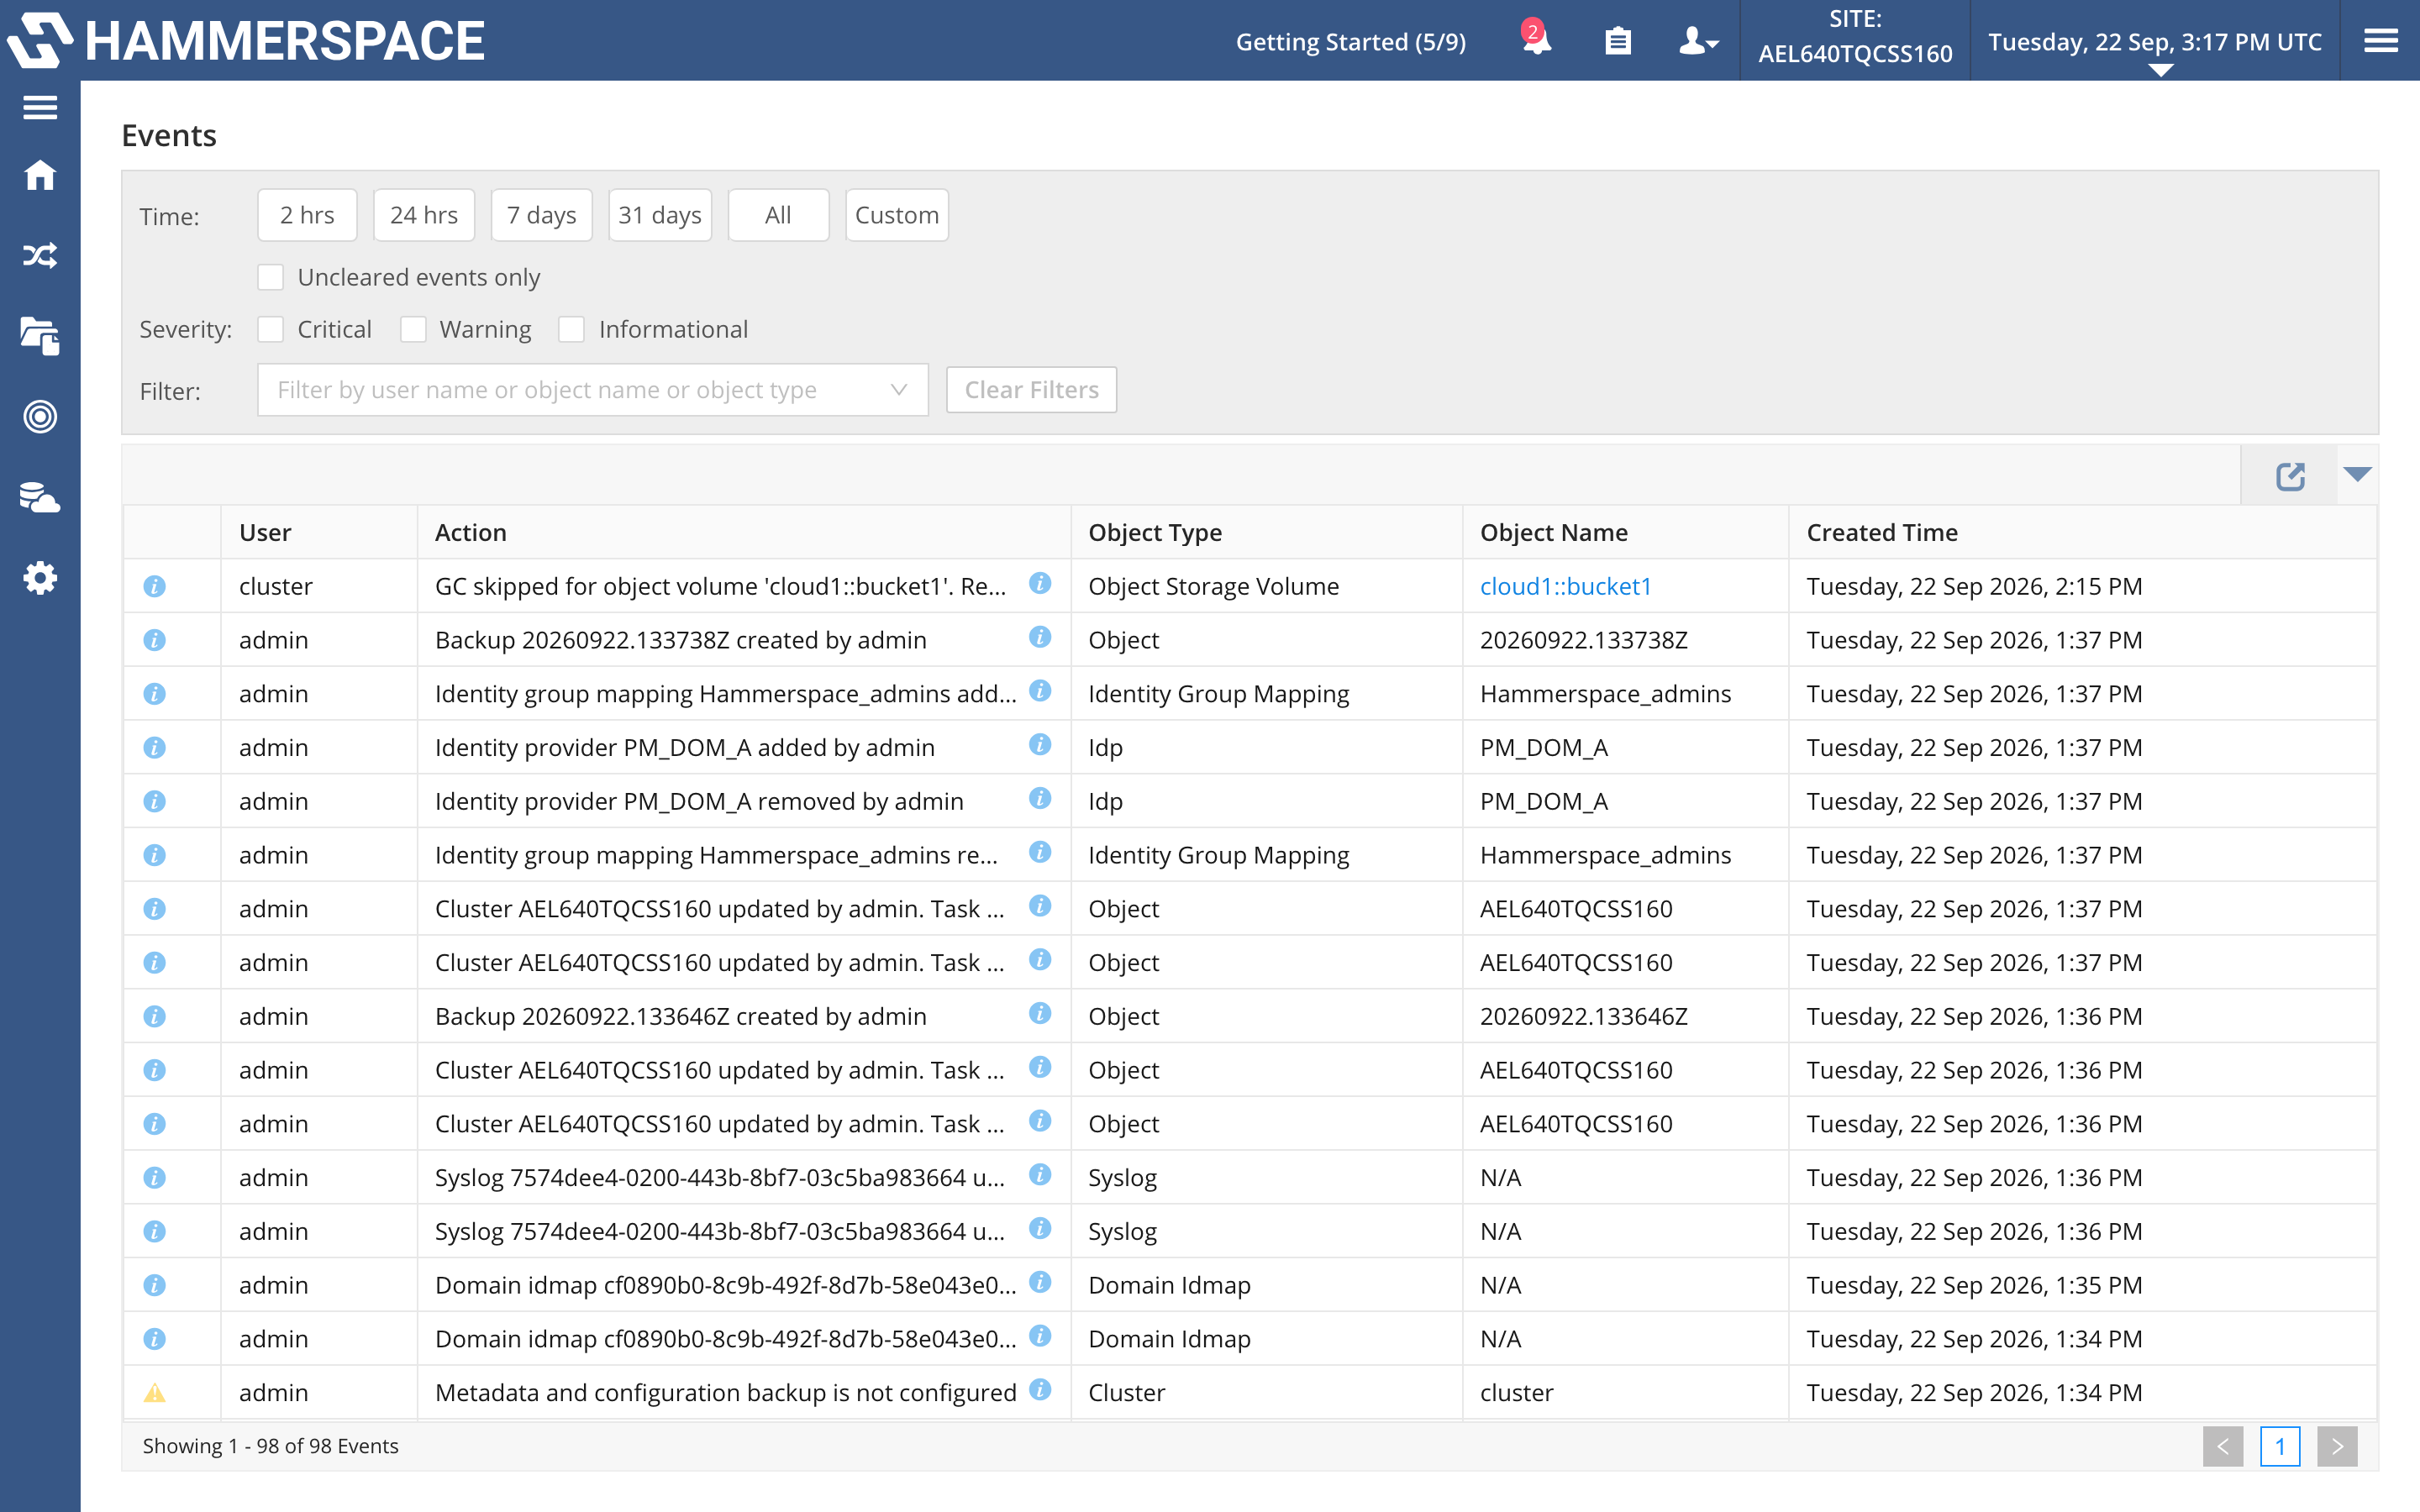 Figure 1. Viewing the Events list
 -
Click View All Events to choose how far back to view the events.
-
Optionally, use the Filter window on the left side of the page to select the events you want to view. You can choose a Time frame, one or more types of events from the Type list, and one or more severities of events from the Severity list:
-
Informational
 — Shows information about a non-critical event, such as, "node added."
 -
Warning
 — Shows information about a warning, such as, "volume is 90% full."
 -
Critical
 — Shows information about a critical event, such as, "out of space".
-
Configuring Event Forwarding
In Hammerspace, events can be forwarded to other sources using syslog or emails. The emails contain the same event information that is shown in the Management GUI or CLI; however, the formatting of the event is slightly different.
Events are sent immediately and not on a schedule; nor are they batched together, so ordinary event types might send several events as they happen, several times; while in the product GUI, those events may just be shown once because they are repeated, and the date of the event reflects when it last happened.
For syslog, you can forward product events and alerts and send file system audit events over a syslog stream. The file-system audit events are only available over syslog and not available over any other event mechanism.
Configuring External Syslog
The system can send events to external syslog server(s) to aid in troubleshooting and log analysis. It is supported to send product events as well as file system auditing events via syslog. The RELP protocol transport for syslog is supported for file system auditing events. See Auditing Access to Data for additional information.
Syslog messages can be configured to be sent via TCP and UDP to an IP address or a hostname. If using a hostname, DNS must be configured.
Perform the following steps to configure and enable sending events to a syslog server:
-
SSH into the management CLI as an admin user.
Command:
# ssh admin@<cluster-management-address> -
Enter the IP address, port, protocol, and event type to use for each server. Use
--serverfor each syslog server you want to add. The example below adds two servers; the first server only receives the events, while the second server receives both events and file system auditing events.Command:
syslog-config --server 192.0.2.50,514,tcp,event --server 192.0.2.51,514,tcp,event|filesystem --enable -
Check the configuration.
Check syslog configurationCommand:
syslog-config --viewExpected output:
Enabled: true Servers: Address: 192.0.2.50 Port: 514 Transport: TCP Message types: [Event] Address: 192.0.2.51 Port: 514 Transport: TCP Message types: [Event, Filesystem] -
To edit the configuration, repeat step 2 with the updated configuration. In this example, we removed the first server.
Command:
syslog-config --server 192.0.2.51,514,tcp,event|filesystem --enable -
Check the configuration.
Check syslog configurationCommand:
syslog-config --viewExpected output:
Enabled:                 true
Servers:
                         Address:                 192.0.2.51
                         Port:                    514
                         Transport:               TCP
                         Message types:           [Event, Filesystem]
Disable and Clear Syslog Configuration
The disable option will clear the syslog configuration and stop events from being propagated via syslog:
syslog-config --disableExamples of Event Notification Emails
Share-create event notification example:
<pdevent>

<uuid>5d52f2f9-670f-42d5-a007-1a0f65e2c88c</uuid>

<timestamp_utc>2025-06-19 16:21:40</timestamp_utc>

<timestamp_utc_offset>+0000</timestamp_utc_offset>

<systemId>7d170b64-c472-453d-a627-94e9f8f363c7</systemId>

<severity>INFORMATIONAL</severity>

<code>ADDED</code>

<description>share Apps added by admin</description>

<user>admin</user>

<originator>Uoid [uuid=621bccf9-cecb-414d-8f2b-7323d2110bd3, objectType=SHARE]</originator>

<technicianatwork>No</technicianatwork>

</pdevent>
Critical-event notification example:
<pdevent>

<uuid>9e7e6124-599f-4ce2-b480-99986ff374c4</uuid>

<timestamp_utc>2025-06-19 16:51:26</timestamp_utc>

<timestamp_utc_offset>+0000</timestamp_utc_offset>

<systemId>7d170b64-c472-453d-a627-94e9f8f363c7</systemId>

<severity>CRITICAL</severity>

<code>MISSING_STORAGE_VOLUME</code>

<description>No writable backend storage volumes. At least 1 writable volume must be added before using the namespace.</description>

<user>admin</user>

<originator>Uoid [uuid=7d170b64-c472-453d-a627-94e9f8f363c7, objectType=CLUSTER]</originator>

<technicianatwork>No</technicianatwork>

</pdevent>
Configuring Email Notifications
Events can be sent via email. The event payload is in XML format. See example notification below.
Enabling email notifications requires the following actions, which are described in greater detail in this section:
Part 1: Configuring the email server
Part 2: Creating a local user within the cluster
Part 3: Adding notification rules
Part 1: Configuring the email server
This step must be performed using the Admin CLI. The configuration can be set and updated with the same command email-config. A single email server can be configured.
Command:
email-config --from-address admin@mycompany.com --host my.mail.server --port 587 --connection-security STARTTLS|
The same |
Optionally, a user and password can be configured if the email server requires credentials.
Part 2: Creating a local user
Continue using the CLI with the user-create command or switch into the GUI and navigate to . Only the viewer role is required for users created for the purpose of viewing notifications.
A local user with a correct email address must be created for every email destination where notifications are sent. For example, emails can be sent to different addresses depending on the severity of the event. The --password option is required; passwords must be 8–20 characters with at least one lowercase letter, one uppercase letter, one digit, and one non-alphanumeric character.
Command:
user-create --email info@example.com --mgmt-role-name viewer --username info_events --password <password>Expected output:
Name:                    info_events
ID:                      8e38eb44-fdb7-4a58-8f7e-93c230f717f8
UID:                     1304
GID:                     100
Email:                   info@example.com
Enabled:                 true
Management role:         viewer
Command:
user-create --email alert@example.com --mgmt-role-name viewer --username alert_events --password <password>Expected output:
Name:                    alert_events
ID:                      ecc55da8-86f4-4fc6-9652-c07847e5a70a
UID:                     1305
GID:                     100
Email:                   alert@example.com
Enabled:                 true
Management role:         viewer
Part 3: Adding notification rules
Create one or more notification event rules that determine what type of notification is sent to where. A notification event rule can be configured with multiple users but only a single threshold. To receive notifications on all thresholds, an event rule must be configured for each threshold.
The thresholds are: INFORMATIONAL | NOTICE | WARNING | ERROR | CRITICAL | ALERT | EMERGENCY.
Example of sending INFORMATIONAL events to a single destination:
notification-rule-create --name info_events --format XML --threshold informational --users info_eventsExample of sending ALERT events to two destinations:
notification-rule-create --name alert_events --format XML --threshold alert --users info_events,alert_eventsViewing the List of Notification Rules
To list all the configured notification rules, use the notification-rule-list command. The following example shows the command and output:
Command:
notification-rule-listExpected output:
total 2
ID:                      bbfc6e61-6c35-46f0-889f-10f2a91be116
Name:                    info_events
Threshold:               INFORMATIONAL
Format:                  xml

ID:                      e3c2ad7f-5c7b-42da-a7f1-e241c017f0eb
Name:                    alert_events
Threshold:               ALERT
Format:                  xml
Viewing the Details of a Notification Rule
To view the details of a notification rule, use the --name option. The following example shows the command and output:
Command:
notification-rule-list --name info_eventsExpected output:
ID:                      bbfc6e61-6c35-46f0-889f-10f2a91be116
Name:                    info_events
Threshold:               INFORMATIONAL
Format:                  xml
Users:
                         [Name: info_events, ID: 8e38eb44-fdb7-4a58-8f7e-93c230f717f8, Enabled: true]
Disabling Email Events
To disable email events, remove the notification rule(s) for the relevant email events. The following example shows the command and output:
notification-rule-remove --name info_events

Success
Configuring Share-Capacity Notifications
When configuring a share size, the system will automatically send a notification when it reaches the defined threshold. The threshold is set or edited using the share-create and share-edit dialogs, respectively.
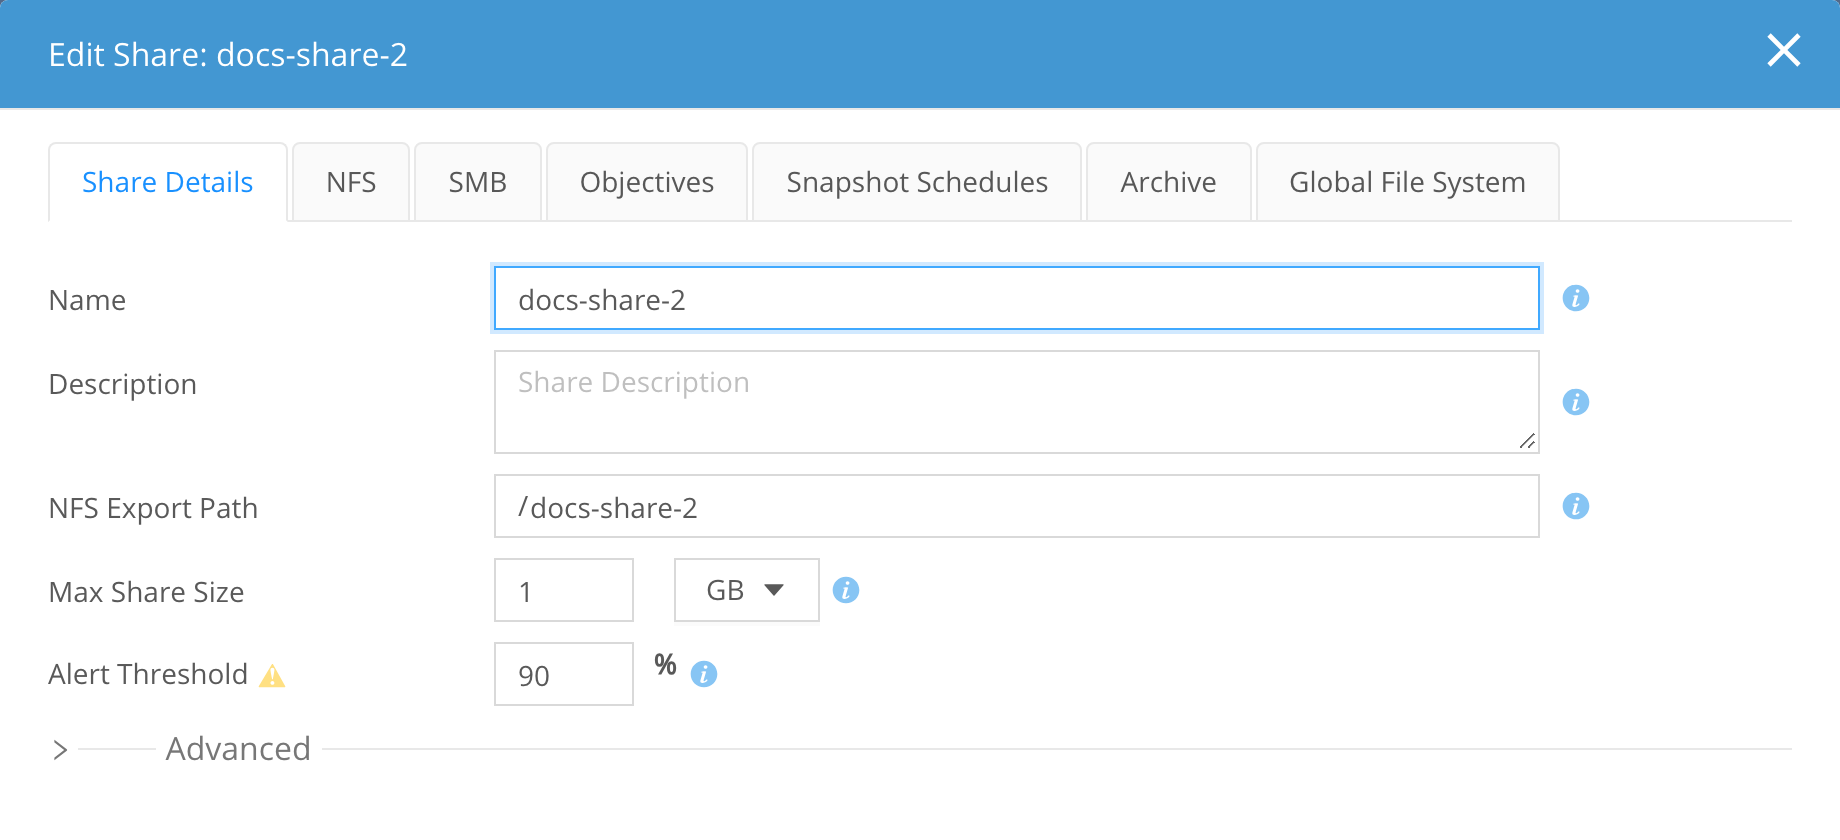
Share capacity events are sent out with a threshold WARNING across all configured event destinations.
Example Share-Capacity Alerts

The following example shows the command and output:
Command:
event-list --type SHARE_QUOTA_WARNINGExpected output:
total 1
ID:                      375bdb12-3e52-4629-b536-1ca2b306bad7
Created:                 2026-09-22 13:28:30 UTC
Modified:                2026-09-22 13:28:30 UTC
Type:                    SHARE_QUOTA_WARNING
Description:             Share 'docs-share-2' quota is running out, crossed 90%
Severity:                WARNING
Source type:             Share
Source ID:               8b7c54c1-fd27-4342-8421-348891951bd8
Source name:             docs-share-2
Cleared:                 false
Viewing Tasks
Administrators can view task activity via the task log. Complete the following steps to view the task log:
-
Click the Tasks (clipboard) icon at the top of the browser window. The Management GUI displays the current running task list.
-
Click View All Tasks to open the Tasks page, which lists your own tasks (My Tasks) and every user’s tasks (All Tasks).
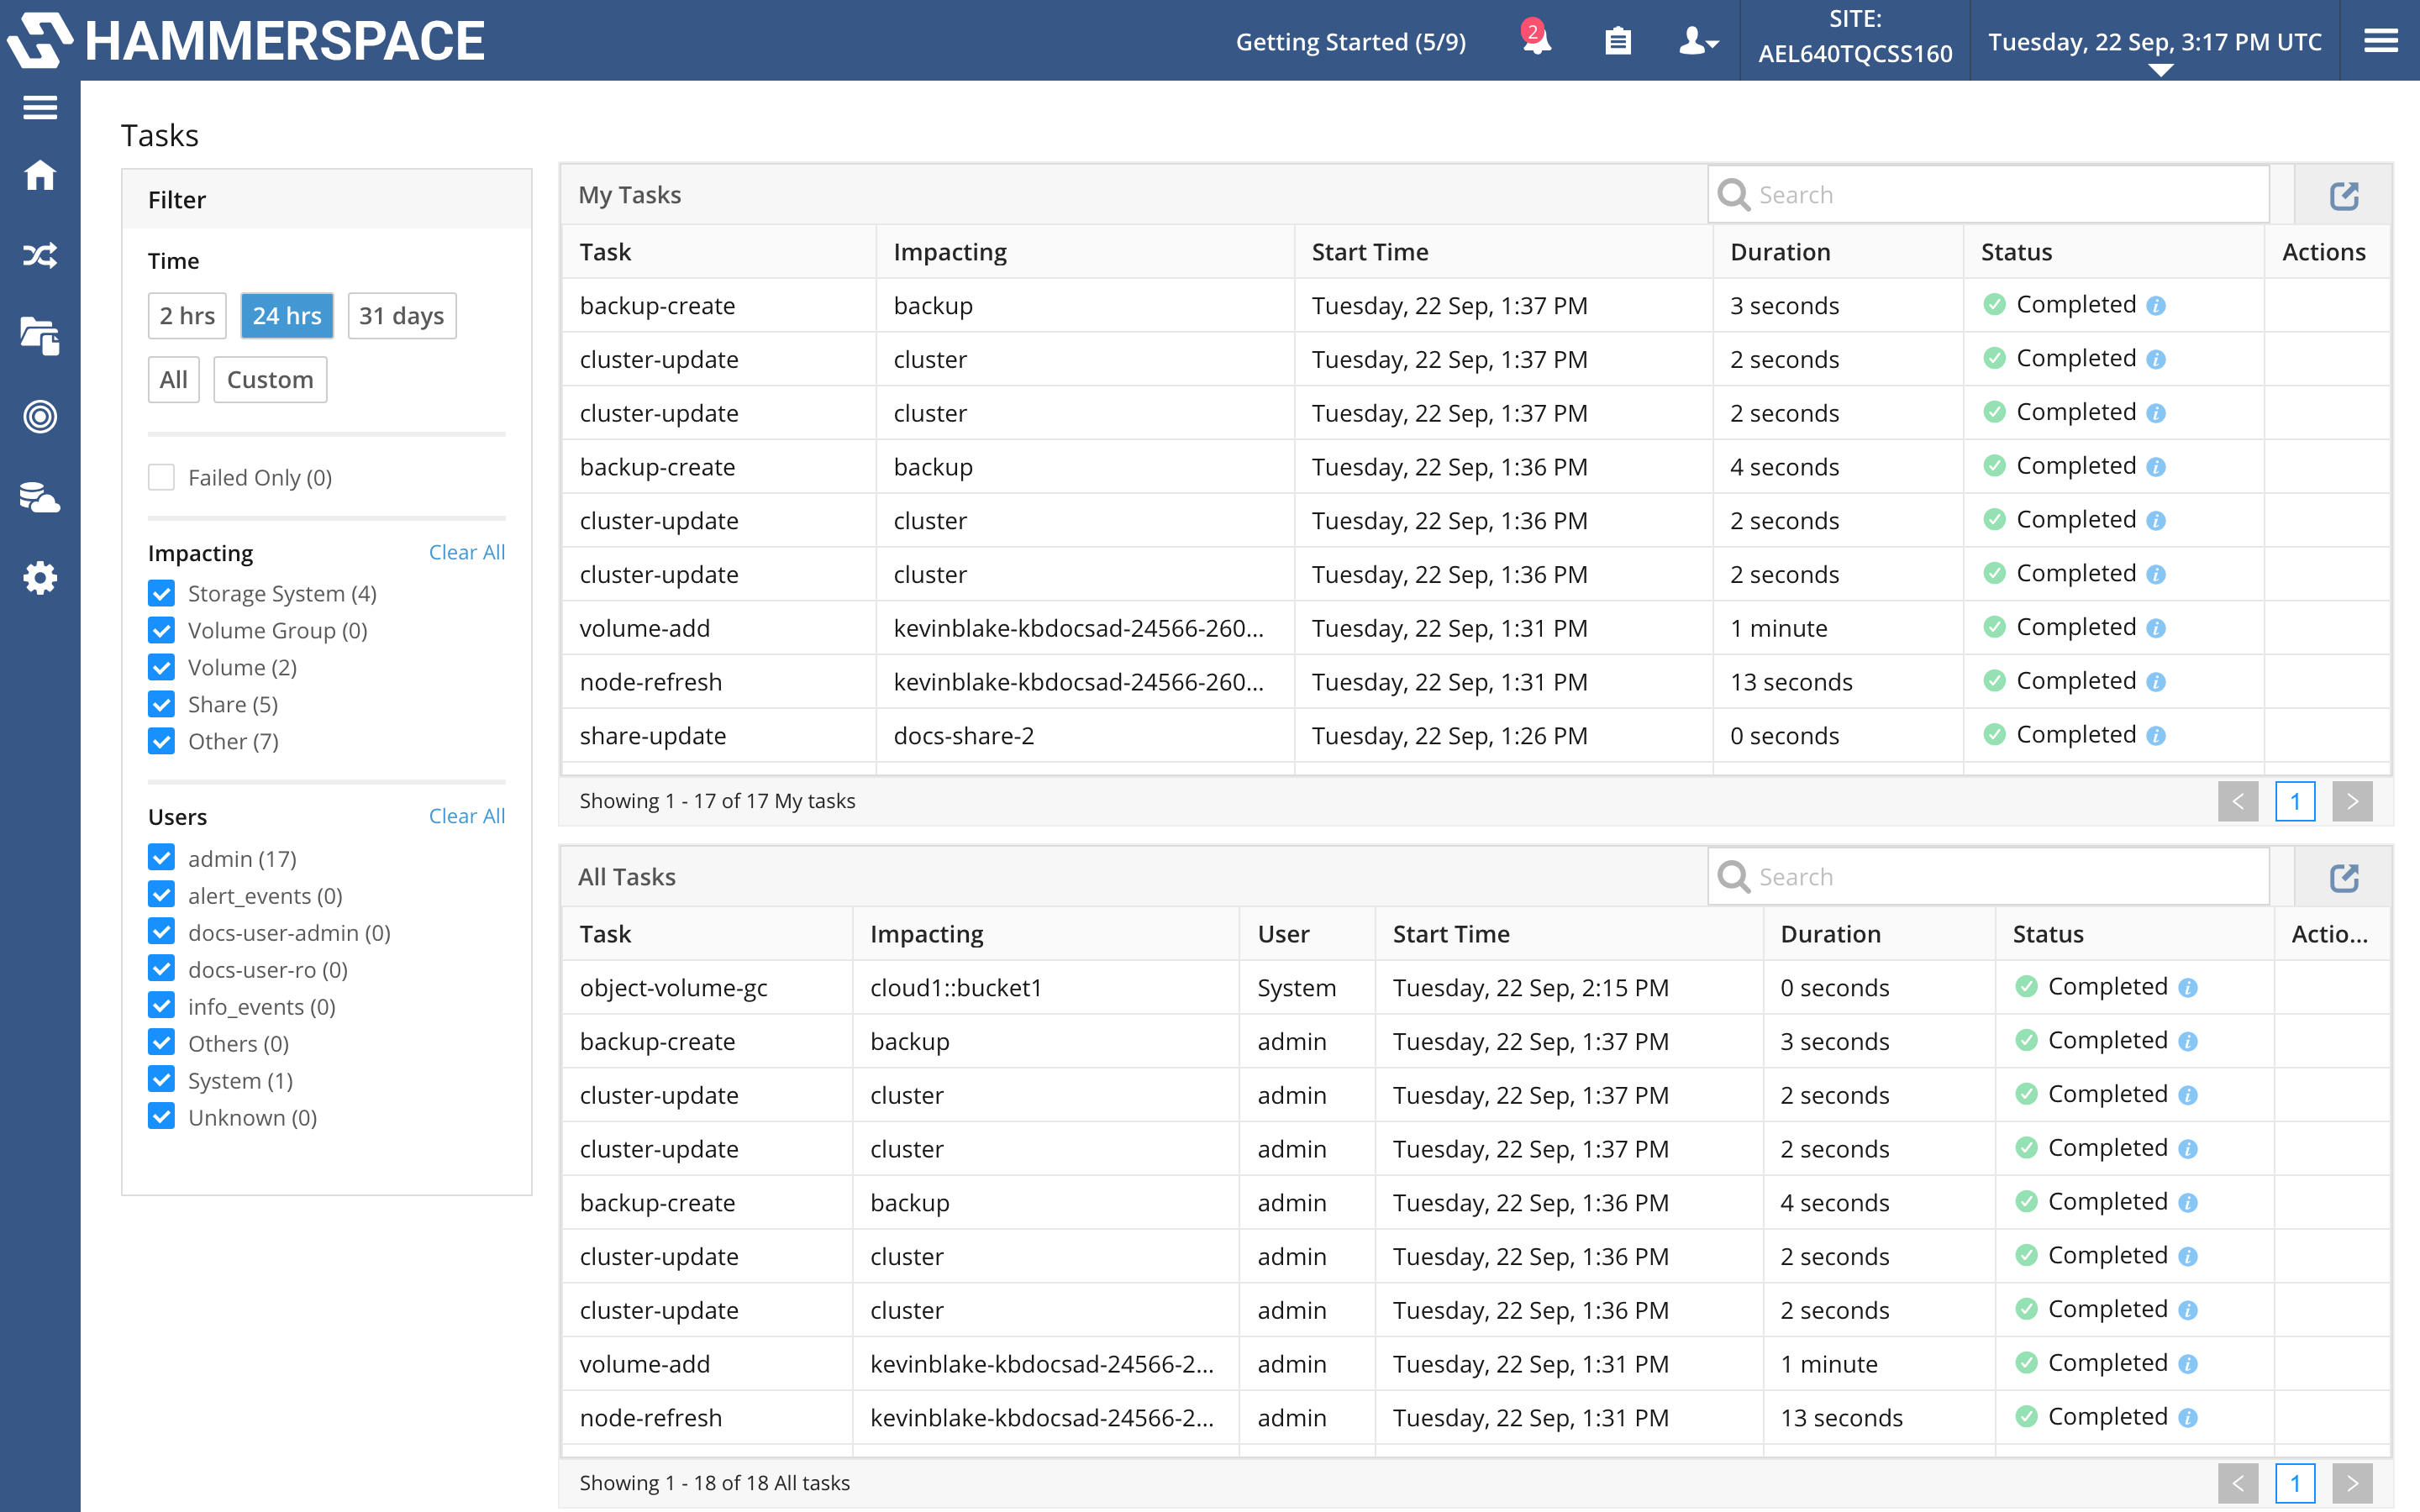 Figure 4. Viewing task activity in the task log
The task list displays the following information about activity in chronological order, from most recent to least:
-
Task: The name of the task that occurred.
-
Impacting: What the task impacted.
-
User: The user who started the task (All Tasks list only).
-
Start Time: The time the task was initiated.
-
Duration: How long the task has been running, or how long it took to finish.
-
Status: The status of the process. Options are:
-
Completed. Tasks that have completed. Completed tasks show 0 minutes to completion.
-
In Progress. Tasks that are currently running. In-progress tasks show the expected time to completion.
-
Failed. Tasks that have exited with a failed status.
-
Hovering over the [i] icon may display additional information about the task.
|